Simple Example from google: http://code.google.com/apis/chart/interactive/docs/gallery/barchart.html
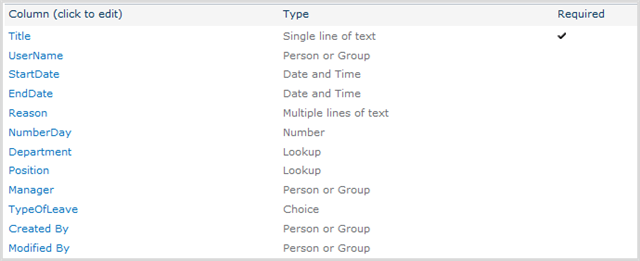
Step 1: Create new list ReportOnChartLeaveForm include fields:
UserName :
Person or Group
StartDate:
Date and Time
EndDate:
Date and Time
Reason:
Multiple lines of text
NumberDay:
Number
Department:
Lookup (Departments List)
Position:
Lookup (Positions List)
Manager:
Person or Group
Step 2: Create new Webpart Solution name is
ReportChartForListLeaveForm
Step 3: Create new Folder name is Script
Step 4: Copy 2 files javascript (jquery-1.4.2.js,
jquery.SPServices-0.5.6.js) to Folder Script and create new file script in
folder Script name is ReportChartForListLeaveForm.js
Step 5: Copy code below to method CreateChildControls()
Literal literal = new Literal();
literal.Text
= "<center><div
id='filter'><select id='startMonth'><option value='01'
selected='selected'>1</option><option
value='02'>2</option><option
value='03'>3</option><option value='04'>4</option><option
value='05'>5</option><option value='06'>6</option><option
value='07'>7</option><option
value='08'>8</option><option
value='09'>9</option><option
value='10'>10</option><option
value='11'>11</option><option value='12'>12</option></select>";
literal.Text
+= "<select id='endMonth'><option
value='01'>1</option><option
value='02'>2</option><option
value='03'>3</option><option
value='04'>4</option><option
value='05'>5</option><option
value='06'>6</option><option value='07'>7</option><option
value='08'>8</option><option value='09'>9</option><option
value='10'>10</option><option
value='11'>11</option><option value='12'
selected='selected'>12</option></select>";
literal.Text
+= "<select id='year'><option
value='2009'>2009</option><option
value='2010'>2010</option><option value='2011'
selected='selected'>2011</option><option
value='2012'>2012</option></select>";
//Load data from list
literal.Text
+= "<select id='department'>";
SPSite spSite = SPControl.GetContextSite(Context);
using (SPWeb spWeb =
spSite.OpenWeb())
{
SPList spList =
spWeb.Lists["Departments"];
SPListItemCollection spListItemCollection
= spList.Items;
foreach (SPListItem item in spListItemCollection)
{
literal.Text
+= "<option value='" + item["ID"] + "'>" + item["DepartmentName"] + "</option>";
}
}
literal.Text
+= "</select>";
literal.Text
+= "<select id='typeOfLeave'><option
value='Sick'>Sick</option><option
value='Personal'>Personal</option><option
value='Annual'>Annual</option><option
value='Maternity'>Maternity</option><option
value='Marriage'>Marriage</option><option
value='Funeral'>Funeral</option><option value='Working
Accident'>Working Accident</option></select>";
literal.Text
+= "<input id='btnReport' type='button'
value='Report' />";
literal.Text
+= "</div></center>";
literal.Text
+= "<center><div id='ReportChart'
style='width: 500px; height: 400px;'>";
literal.Text
+= "</div></center>";
this.Controls.Add(literal);
Literal literalReport = new Literal();
literalReport.Text
+= "<script>$('#btnReport').click(function
() {GetData();});</script>";
this.Controls.Add(literalReport);
Page.ClientScript.RegisterClientScriptInclude("TheFirtScript", "wpresources/jquery-1.4.2.js");
Page.ClientScript.RegisterClientScriptInclude("TheSecondScript", "wpresources/jquery.SPServices-0.5.6.js");
Page.ClientScript.RegisterClientScriptInclude("TheThirtScript", "https://www.google.com/jsapi");
Page.ClientScript.RegisterClientScriptInclude("MainScript", "wpresources/ReportChartForListLeaveForm.js");
google.load("visualization", "1", { packages: ["corechart"]
});
var arrayNumberDay = '';
var arrayUser = '';
function GetData() {
arrayUser
= ''; //Restart value
arrayNumberDay
= ''; //Restart value
//Get value from Dropdownlist
var ddlYear = $("#year").attr("value");
var ddlStartMonth = $("#startMonth").attr("value");
var ddlEndMonth = $("#endMonth").attr("value");
var ddlDepartment = $("#department").attr("value");
var ddlTypeOfLeave =
$("#typeOfLeave").attr("value");
//Get array user
$().SPServices({
operation: "GetListItems",
async: false,
listName: "ReportOnChartLeaveForm",
completefunc: function (xData, Status) {
//alert(xData.responseXML.xml);
$(xData.responseXML).find("z\\:row").each(function () {
var startDate = $(this).attr("ows_StartDate"); //2011-08-01
00:00:00
var startYear =
startDate.substring(0, 4); //2011
var startMonth =
startDate.substring(5, 7); //08
var department = $(this).attr("ows_Department");//1;# Information Technology
department
= department.split(';'); //1 and #
Information Technology
department
= department[0];//1
var typeOfLeave = $(this).attr("ows_TypeOfLeave");//Sick
if (typeOfLeave ==
ddlTypeOfLeave) {
if (department ==
ddlDepartment) {
if (startYear ==
ddlYear) {
//alert(startMonth+">="+ddlStartMonth
+"&&"+ startMonth+"<="+ddlEndMonth);
if (startMonth >=
ddlStartMonth && startMonth <= ddlEndMonth) {
//alert(ddlStartMonth+"to"+ddlEndMonth);
var userName = $(this).attr("ows_UserName"); //2;#ACER\\ituser1
userName
= userName.split('#'); //2; and
ACER\\ituser1
userName
= userName[1]; //ACER\\ituser1
arrayUser
+= userName + ";"; //ACER\\ituser1;
}
}
}
}
});
}
});
//Filter user similar
arrayUser
= arrayUser.substring(0, arrayUser.length - 1); //ACER\\ituser1;ACER\\ituser2; => ACER\\ituser1;ACER\\ituser2
//alert(arrayUser);
arrayUser
= arrayUser.split(';'); //ACER\\ituser1 and
ACER\\ituser2
//alert(arrayUser.length); =>
ACER\\itleader1;ACER\\itleader1;ACER\\ituser1;ACER\\ituser1;ACER\\ituser2
for (var i = 0; i <
arrayUser.length; i++) {
for (var j = i + 1; j <
arrayUser.length; j++) {
//alert("j"+j);
if (arrayUser[i] ==
arrayUser[j]) {
Array.removeAt(arrayUser,
j);
j--;
//alert("arrayUser.length"+arrayUser.length);
}
}
}
//alert(arrayUser.length); => ACER\\itleader1;ACER\\ituser1;ACER\\ituser2
//Get array Number Days Leave Form of Employees from
startmonth to endmonth
for (var i = 0; i <
arrayUser.length; i++) {
var day = 0;
$().SPServices({
operation: "GetListItems",
async: false,
listName: "ReportOnChartLeaveForm",
completefunc: function (xData, Status) {
//alert(xData.responseXML.xml);
$(xData.responseXML).find("z\\:row").each(function () {
var startDate = $(this).attr("ows_StartDate"); //2011-08-01
00:00:00
var startYear =
startDate.substring(0, 4);
var startMonth =
startDate.substring(5, 7);
var department = $(this).attr("ows_Department");
department
= department.split(';');
department
= department[0];
var typeOfLeave = $(this).attr("ows_TypeOfLeave");
if (typeOfLeave ==
ddlTypeOfLeave) {
if (department ==
ddlDepartment) {
if (startYear ==
ddlYear) {
//alert(startMonth+">="+ddlStartMonth
+"&&"+ startMonth+"<="+ddlEndMonth);
if (startMonth >=
ddlStartMonth && startMonth <= ddlEndMonth) {
//alert(ddlStartMonth+"to"+ddlEndMonth);
var numberDay = $(this).attr("ows_NumberDay");
var userName = $(this).attr("ows_UserName");
userName
= userName.split('#');
userName
= userName[1];
if (userName ==
arrayUser[i]) {
day
+= parseFloat(numberDay);//1+=2=>6
}
}
}
}
}
});
}
});
//Plus arrar Number Day
arrayNumberDay
+= day + ';'; //3;4;5;
}
arrayNumberDay
= arrayNumberDay.substring(0, arrayNumberDay.length - 1); //3;4;5
//Convert arrayNumberDay to Array
arrayNumberDay
= arrayNumberDay.split(';');
//alert(arrayNumberDay + "--" + arrayUser);
//alert(arrayNumberDay.length);
// Now, we have ddlStartMonth+"to"+ddlEndMonth,
arrayUser, arrayNumberDay
DrawChart(ddlStartMonth,
ddlEndMonth, arrayUser, arrayNumberDay);
}
// Draw chart
function DrawChart(ddlStartMonth,
ddlEndMonth, arrayUser, arrayNumberDay) {
var fromMonthToMothLeave
= ddlStartMonth + "->" + ddlEndMonth;
var data = new google.visualization.DataTable();
data.addColumn('string', 'NumberDay');
//Add column
for (var i = 0; i <
arrayUser.length; i++) {
data.addColumn('number', '"' + arrayUser[i] + '"');
}
//Add row
data.addRows(1);
//Add value
data.setValue(0,
0, '"' +
fromMonthToMothLeave + '"');
//alert(arrayNumberDay.length);
for (var j = 0; j <
arrayNumberDay.length; j++) {
data.setValue(0,
j + 1, parseFloat(arrayNumberDay[j]));
//alert((j+1)+""+parseFloat(arrayNumberDay[j]));
}
var chart = new google.visualization.BarChart(document.getElementById('ReportChart'));
chart.draw(data,
{ width: 500, height: 400, title: 'Leave
Form Of Employees',
vAxis:
{ title: 'From Month To Month', titleTextStyle: { color: 'red'} }
});
}
Step 7: Copy 3 file in file Script (jquery-1.4.2.js,
jquery.SPServices-0.5.6.js, ReportChartForListLeaveForm.js) to folder wpresources
with path below C:\inetpub\wwwroot\wss\VirtualDirectories\8888\wpresources
Step 9: Open List ReportOnChartLeaveForm in sharepoint
site
Step 10: Click Site Action | Edit Page | Insert WebPart | Custom |
add webpart ReportChartForListLeaveForm and see result below
Guide deploy project:
Download file .rar name is demo include: List template (Positions,
Departments, ReportOnChartLeaveForm), Script, Project at here http://www.mediafire.com/?2zikhapx5onr4
Step 1: Open Project which you downloaded to your computer
Step 2: Click left mouse to project
ReportChartForList_LeaveFormApp
Step 5: Create new List base on list template (Positions,
Departments, ReportOnChartLeaveForm)
Step 6: Verify Fields Position and Department in list
ReportOnChartLeaveForm (delete and create new)
Step 7: Copy 3 files JS (jquery-1.4.2.js,
jquery.SPServices-0.5.6.js, ReportChartForListLeaveForm.js) to folder wpresources
with path below C:\inetpub\wwwroot\wss\VirtualDirectories\8888\wpresources


0 comments:
Post a Comment